Last year, we started working on SolidTelemetry, a database-backed OpenTelemetry implementation for Rails apps. SolidTelemetry doesn’t just pre-set OpenTelemetry for your application, it also comes with some other cool features:
- stores metrics and traces in your database (PostgreSQL, MySQL, and SQLite3)
- exports CPU, memory, and requests metrics
- adds performance analysis to your application (ala AppSignal)
- adds error tracking to your application (ala Rollbar)
The amount of data it collects is astonishing, as it collects CPU and memory metrics every minute and a lot of spans for every request. It can easily collect thousands of spans per request. Then, the more your application is used, the more spans it will collect.
In SolidTelemetry, you can see a paginated list of traces, filter them by name and date, and inspect them: a pretty common index and show pages. But you can see how its performance degrades as the number of records grows. It becomes evident when the number of records exceeds 6 million. For example, with a sample of 100 requests:
| Records | P50 | P95 | P99 |
|---|---|---|---|
| ~ 4 million | 587ms | 756ms | 907ms |
| ~ 6 million | 1289ms | 1465ms | 1760ms |
| ~ 8 million | 2039ms | 3340ms | 4594ms |
In SolidTelemetry, you can easily exceed these numbers in a matter of hours, but any application that has a fair amount of usage or that collects analytics might face a similar issue sooner or later. So, we will keep this post generic so that it can be extrapolated to other situations.
The first thing we need to do is find the root cause of this slow action. We can do that by simply inspecting the application logs. The culprits were found instantly.
Populating the span name filter
The spans index page has two filters, by name and by date range. The name filter is presented as a select tag whose options are the span names of the root spans.
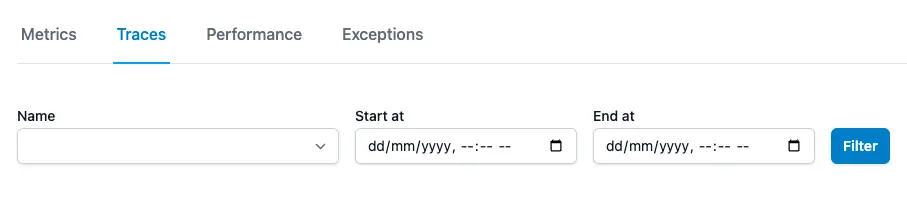
The span names are stored in the solid_telemetry_spans table as a string, and the filter is populated by running the following query:
SolidTelemetry::Span.roots.select(:name).uniq
Which translates to:
SELECT DISTINCT "solid_telemetry_spans"."name" FROM "solid_telemetry_spans" WHERE "solid_telemetry_spans"."parent_span_id" IS NULL ORDER BY "solid_telemetry_spans"."name" ASC
With around 8 million spans, the query is in the order of seconds. For example:
SolidTelemetry::Span Pluck (2318.6ms) SELECT DISTINCT "solid_telemetry_spans"."name" FROM "solid_telemetry_spans" WHERE "solid_telemetry_spans"."parent_span_id" IS NULL ORDER BY "solid_telemetry_spans"."name" ASC
But why is it slow? The solid_telemetry_spans table has an index on parent_span_id and name, so supposedly this query should be fast. We can use Postgres’ EXPLAIN ANALYZE to analyze the query plan:
telemetry_development=# EXPLAIN ANALYZE SELECT DISTINCT "solid_telemetry_spans"."name" FROM "solid_telemetry_spans" WHERE "solid_telemetry_spans"."parent_span_id" IS NULL ORDER BY "solid_telemetry_spans"."name" ASC;
                                                                                                    QUERY PLAN
------------------------------------------------------------------------------------------------------------------------------------------------------------------------------------------------------------------
 Sort  (cost=604065.11..604065.17 rows=25 width=18) (actual time=2552.447..2552.447 rows=21 loops=1)
   Sort Key: name
   Sort Method: quicksort  Memory: 26kB
   ->  HashAggregate  (cost=604064.28..604064.53 rows=25 width=18) (actual time=2552.393..2552.394 rows=21 loops=1)
         Group Key: name
         Batches: 1  Memory Usage: 24kB
         ->  Index Only Scan using index_solid_telemetry_spans_on_parent_span_id_and_name on solid_telemetry_spans  (cost=0.56..602245.38 rows=727560 width=18) (actual time=0.629..2463.555 rows=736865 loops=1)
               Index Cond: (parent_span_id IS NULL)
               Heap Fetches: 275547
 Planning Time: 0.371 ms
 JIT:
   Functions: 5
   Options: Inlining true, Optimization true, Expressions true, Deforming true
   Timing: Generation 1.094 ms, Inlining 8.826 ms, Optimization 14.001 ms, Emission 8.556 ms, Total 32.477 ms
 Execution Time: 2553.800 ms
(15 rows)
The query plan shows how the query works:
- Scans the
solid_telemetry_spanstable using the index, filtering those rows whereparent_span_id IS NULL. To perform this operation, 727,560 rows are scanned, and then there are 275,547 heap fetches (fetching additional data from the heap). - Groups the rows by the
namecolumn. 21 rows were produced. - Sorts the result set by the
namecolumn. 21 rows were sorted.
As you can see, the query becomes expensive due to the large number of rows scanned (736,865) and the heap fetches (275,547). It’s a long process to produce only 21 rows.
The solution
Now that the query is explained, let’s explore one of the most common strategies for this kind of problem: caching. It’s a quick and dirty approach to solving this problem: “Is the query too slow? Let’s do it less often, let’s cache it and move on”.
As you might have already figured out, it won’t cut it. Remember, we insert thousands of records per second, so the cache will be almost immediately invalidated. That means we would make the query less often, but when we do, it will still be slow.
Paraphrasing Nate Berkopec: Cache works to make a fast application faster, not make a slow application fast.
The evident solution, then, is getting rid of the unique aggregation operation. And for that, we can rely on database modelling: the span name should be extracted and normalized into its own table (solid_telemetry_span_names). The change is trivial, but the performance improvement is huge.
Pagination
As mentioned above, SolidTelemetry provides a paginated list of traces, the spans index page. To show the pagination controls, Kaminari (the gem we’re using to paginate the list) performs this query:
SELECT COUNT(*) FROM "solid_telemetry_spans" WHERE "solid_telemetry_spans"."parent_span_id" IS NULL AND 1=1
This query is particularly used to calculate the number of pages of the list. The solid_telemetry_spans table also has an index on the parent_span_id column. This way, the query should be fast because it should use the index. Similarly to the query above, this query becomes slow when the table has a huge number of records:
SolidTelemetry::Span Count (1561.1ms) SELECT COUNT(*) FROM "solid_telemetry_spans" WHERE "solid_telemetry_spans"."parent_span_id" IS NULL AND 1=1
Similarly to the query above, we can use EXPLAIN ANALYZE to try and see how it can be improved:
telemetry_development=# EXPLAIN ANALYZE SELECT COUNT(*) FROM "solid_telemetry_spans" WHERE "solid_telemetry_spans"."parent_span_id" IS NULL AND 1=1;
                                                                                            QUERY PLAN
--------------------------------------------------------------------------------------------------------------------------------------------------------------------------------------------------
 Aggregate  (cost=672119.04..672119.05 rows=1 width=8) (actual time=3147.125..3147.126 rows=1 loops=1)
   ->  Index Only Scan using index_solid_telemetry_spans_on_parent_span_id on solid_telemetry_spans  (cost=0.43..670233.30 rows=754294 width=0) (actual time=1.185..3103.974 rows=849876 loops=1)
         Index Cond: (parent_span_id IS NULL)
         Heap Fetches: 388560
 Planning Time: 0.227 ms
 JIT:
   Functions: 3
   Options: Inlining true, Optimization true, Expressions true, Deforming true
   Timing: Generation 0.588 ms, Inlining 2.706 ms, Optimization 5.405 ms, Emission 10.981 ms, Total 19.680 ms
 Execution Time: 3147.852 ms
(10 rows)
The query plan shows how the query works:
- Scans the
solid_telemetry_spanstable using the index on theparent_span_idcolumn, filtering rows whereparent_span_id IS NULL. It scans 849,876 rows, and then it performs 388,560 heap fetches. - It performs the aggregate function (
COUNT) on the rows, producing 1 row.
Again, the query becomes expensive due to the large number of rows scanned (849,876) and the heap fetches (388,560). It’s a long process to produce only 1 row.
The solution
This time, the solution isn’t evident. You need to know the number of records in the solid_telemetry_spans table to properly calculate the number of pages to show the pagination controls. And if you have a huge number of records, there’s no other way than just scanning the index and accessing the heap. However, this is unacceptable as it significantly increases the time for a simple page.
There’s an alternative to this kind of pagination: countless pagination. Countless pagination doesn’t perform this COUNT query, however, this comes at a cost: you can’t show the same pagination controls. That is, you can only show the next and previous links, but can no longer jump to a specific page.
The change is trivial too, you need to add .without_count to your collection (eg, SolidTelemetry::Span.page(params[:page]).without_count) and then show the next and previous links accordingly.
Applying the changes
After applying the changes mentioned in the previous sections, we can see a great improvement:
| Records | P50 | P95 | P99 |
|---|---|---|---|
| ~ 4 million | 179ms | 217ms | 285ms |
| ~ 6 million | 160ms | 186ms | 210ms |
| ~ 8 million | 157ms | 184ms | 217ms |
Before applying the changes, we could see that there was a correlation between the number of records in the solid_telemetry_spans table and the time it took to complete a request (linear complexity). After applying the changes explained in the previous sections, we could see that the number of records in the solid_telemetry_spans table no longer has an effect on the request time, making it of constant complexity.
Note: it’s actually a linear complexity because it still needs to scan the whole index in the solid_telemetry_span_names table, but since the number of records is much less than the solid_telemetry_spans table, the complexity of running that query is negligible.
The changes consisted, as explained above, of:
- create a
solid_telemetry_spanstable and, when a span is saved, find or create a span name in that table and associate the span with the span name - countless pagination for the view
By extracting the name into a separate table, we don’t get rid of the linear complexity of the query, but the number of records that need to be scanned is closer to zero. The new query is:
SolidTelemetry::SpanName.order(:name).pluck(:name)
Which translates to:
SELECT "solid_telemetry_span_names"."name" FROM "solid_telemetry_span_names" ORDER BY "solid_telemetry_span_names"."name" ASC
And you can see the query plan is much easier now:
telemetry_development=# EXPLAIN ANALYZE SELECT "solid_telemetry_span_names"."name" FROM "solid_telemetry_span_names" ORDER BY "solid_telemetry_span_names"."name" ASC;
                                                                                  QUERY PLAN
-------------------------------------------------------------------------------------------------------------------------------------------------------------------------------
 Index Only Scan using index_solid_telemetry_span_names_on_name on solid_telemetry_span_names  (cost=0.15..62.70 rows=970 width=32) (actual time=0.041..0.048 rows=70 loops=1)
   Heap Fetches: 70
 Planning Time: 0.067 ms
 Execution Time: 0.058 ms
(4 rows)
This time, the query performs an index-only scan, making it very efficient with low planning and execution times.
Conclusion
Slow page load times are frequently caused by inefficient queries. It’s tempting to add a cache to avoid running these queries repeatedly, but for tables that change frequently, this isn’t a good solution. The cache would be invalidated often, which would result in the slow queries still being run frequently.
In cases like this, you should look at your database and check if the indexes are properly set up. If they are, check if the query plan uses them efficiently. And if not, try to come up with alternative solutions, such as the ones above.