You’ve built an AI-powered feature into your Rails application using LLMs. You’ve built an evaluation set to test different prompts and model combinations, compared them, and improved them1 so you could get the best bang for the buck out of your LLM usage. You aimed for the highest accuracy at the lowest possible cost. You deployed it to production. And now?
Unlike most APIs, LLM APIs calls have variable costs. They are usage-based, so the price depends on input and output tokens consumed. So, how do you know how your users are using it? Or, how much will it cost you monthly? Is it what you estimated, and are the usage limits you designed ok? Are they needed at all?
Why monitoring LLM interactions matters
Beyond basic visibility, monitoring unlocks practical improvements:
- Cost management: Track which models and features are costing you money, then focus optimization efforts where they matter. When 80% of your costs come from one feature, you can try a cheaper model, add caching, optimize prompts, or, if the provider and feature allow it, batch processing.
- Performance tracking and anomaly detection: Monitor response times to identify slow prompts and set realistic expectations. A sudden spike in latency or requests usually means something changed—a bug causing retries, or model performance issues—and monitoring helps you correlate changes with their impact.
- Capacity planning: Understanding your throughput patterns (requests per minute, hour, day) helps you forecast costs and identify features that might benefit from caching or batching.
- Provider comparison: With multiple LLM providers offering similar capabilities at different price points, monitoring helps you make informed decisions about which model delivers the best results for your use case.
- Reporting: Product managers and stakeholders want to know what AI is costing. With monitoring data in your database, generating reports is a SQL query away.
- Model migration planning: When a provider releases a new model or changes pricing, you can estimate the impact on your costs before making the switch.
Introducing RubyLLM::Monitoring
As you might guess, after deploying our AI-powered features, we had several usage spikes that threatened the viability of the features. We needed to monitor our LLM usage in production. At the beginning, we did it manually, using whatever each inference platform provided. But as we started using different providers and models on several features, manually tracking cost and token usage became complicated and error-prone. So we built RubyLLM::Monitoring: a Rails engine that tracks every LLM request your application makes and provides a dashboard where you can see cost, throughput, response time, and error aggregations. On top of it, you can set up alerts so that when something interesting to you happens, you receive an email or a Slack notification.
As the name suggests, it’s built on top of RubyLLM and integrates seamlessly with your existing setup. No separate infrastructure, no external services, just another engine mounted in your Rails app.
How it works
The engine instruments every LLM request your app makes (stay tuned for a related post) and saves it to your database. Cost is calculated automatically using RubyLLM’s built-in pricing data. Since everything lives in your database, you can run custom queries when the dashboard isn’t enough.
The dashboard
Once installed, you get a dashboard at /monitoring (or wherever you mount it) with:
- Summary cards showing total requests, total cost, average response time, and error rate.
- A breakdown table grouping metrics by provider and model, so you can see at a glance which models are being used and what they’re costing you.
- Metrics:
- Throughput: Request count over time
- Cost: Accumulated costs per time window
- Response time: Average latency trends
- Error rate: Percentage of failed requests
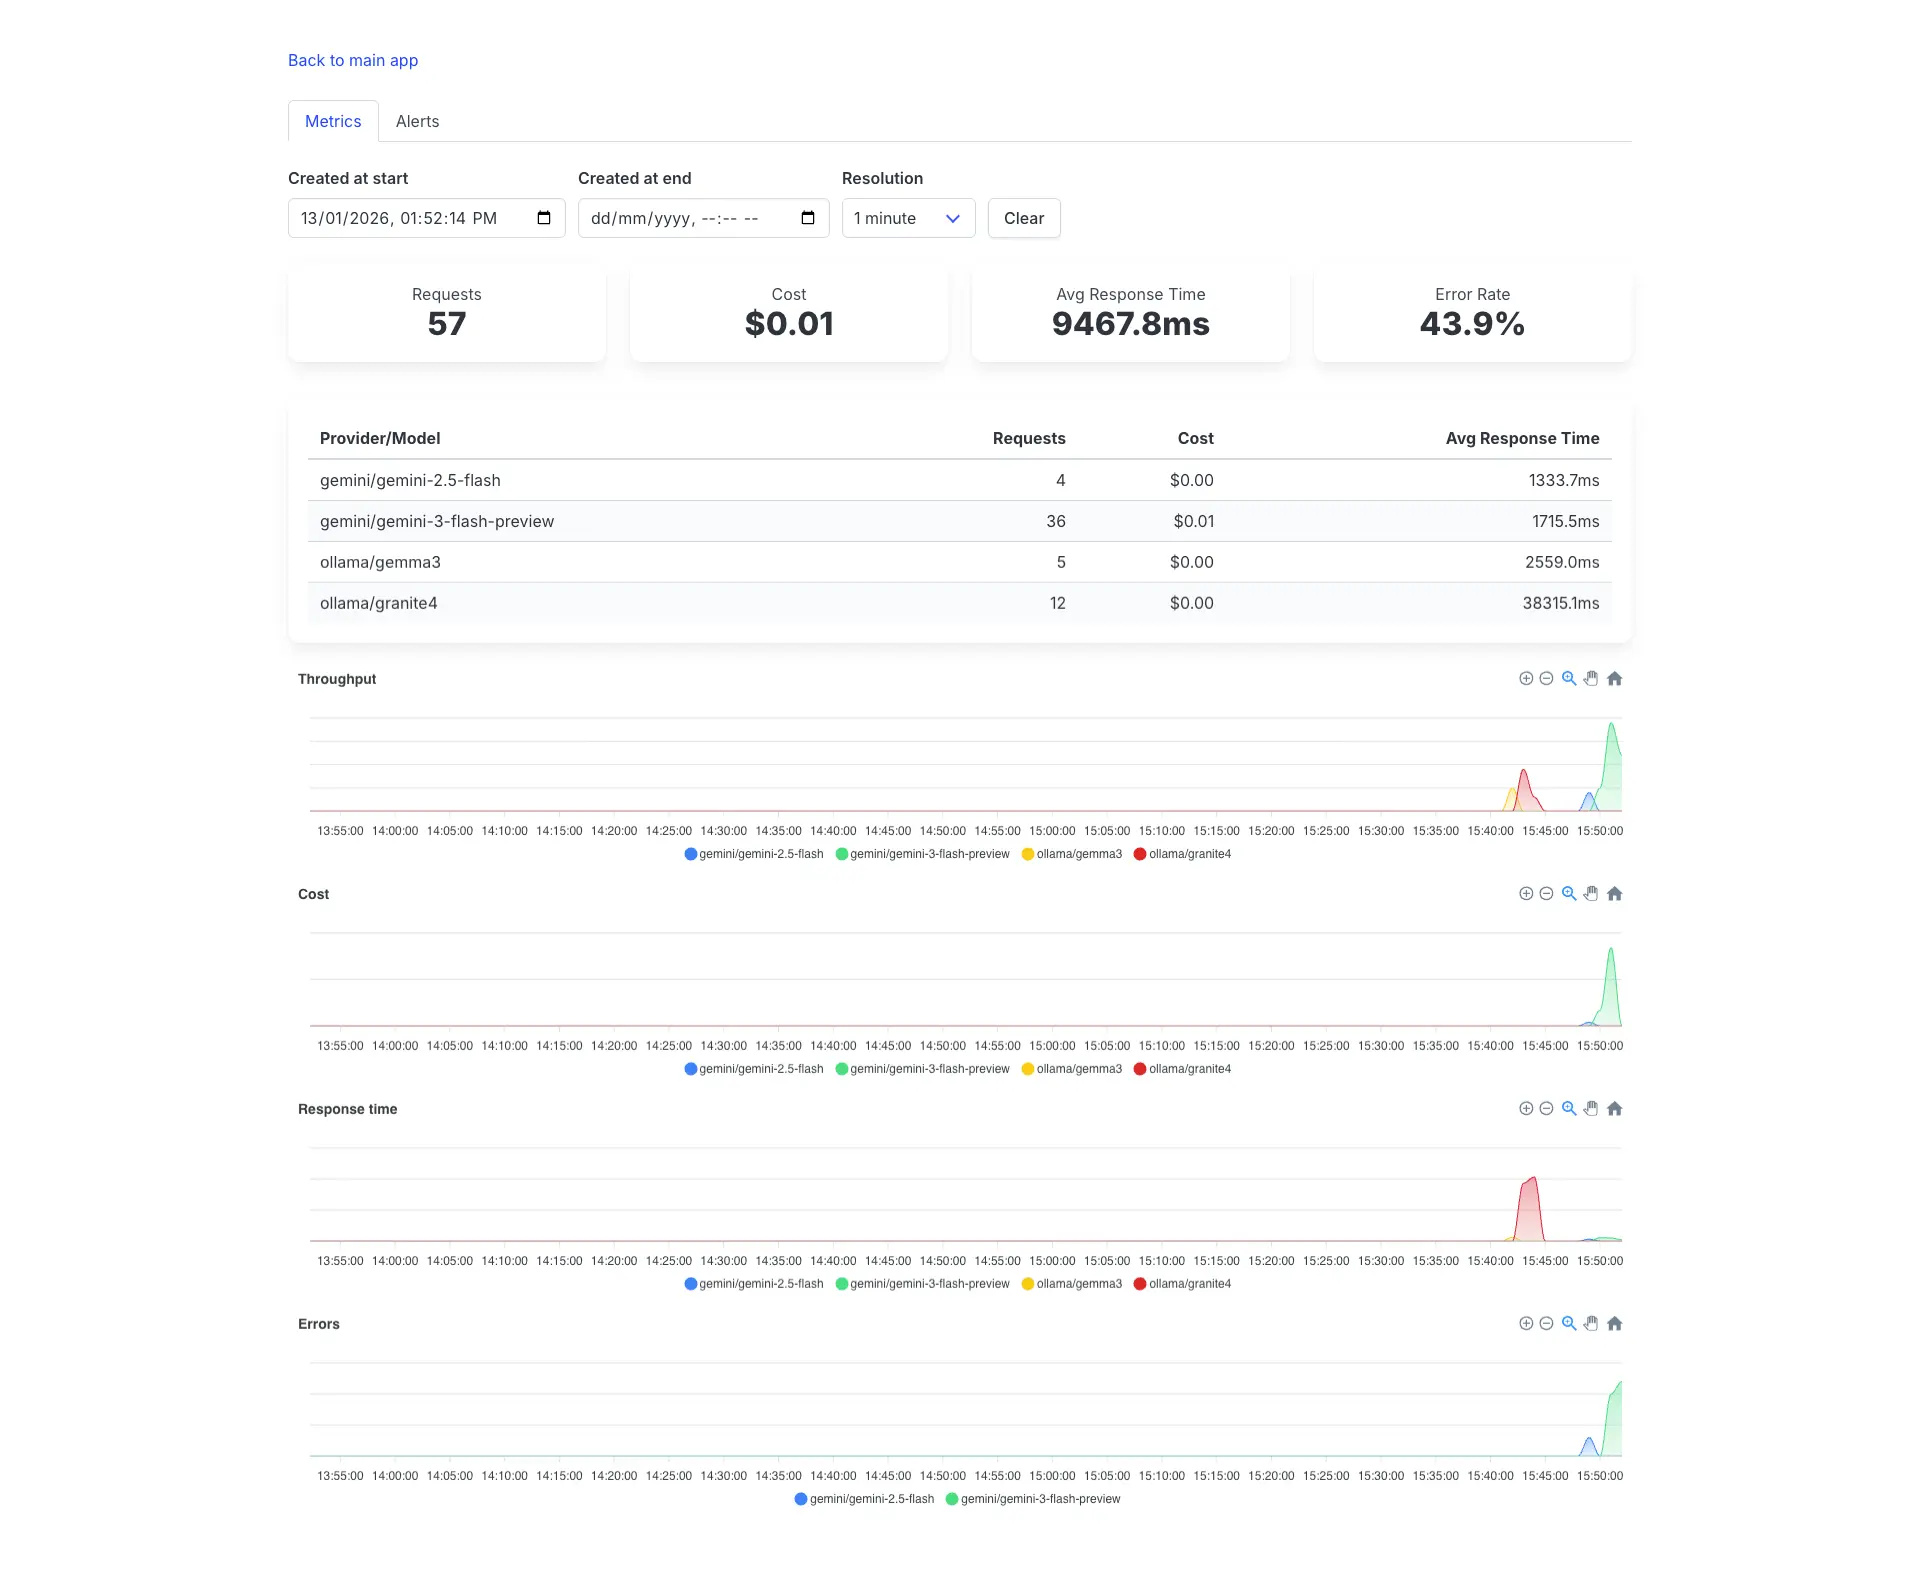
Demo with slow responses and a high error rate.
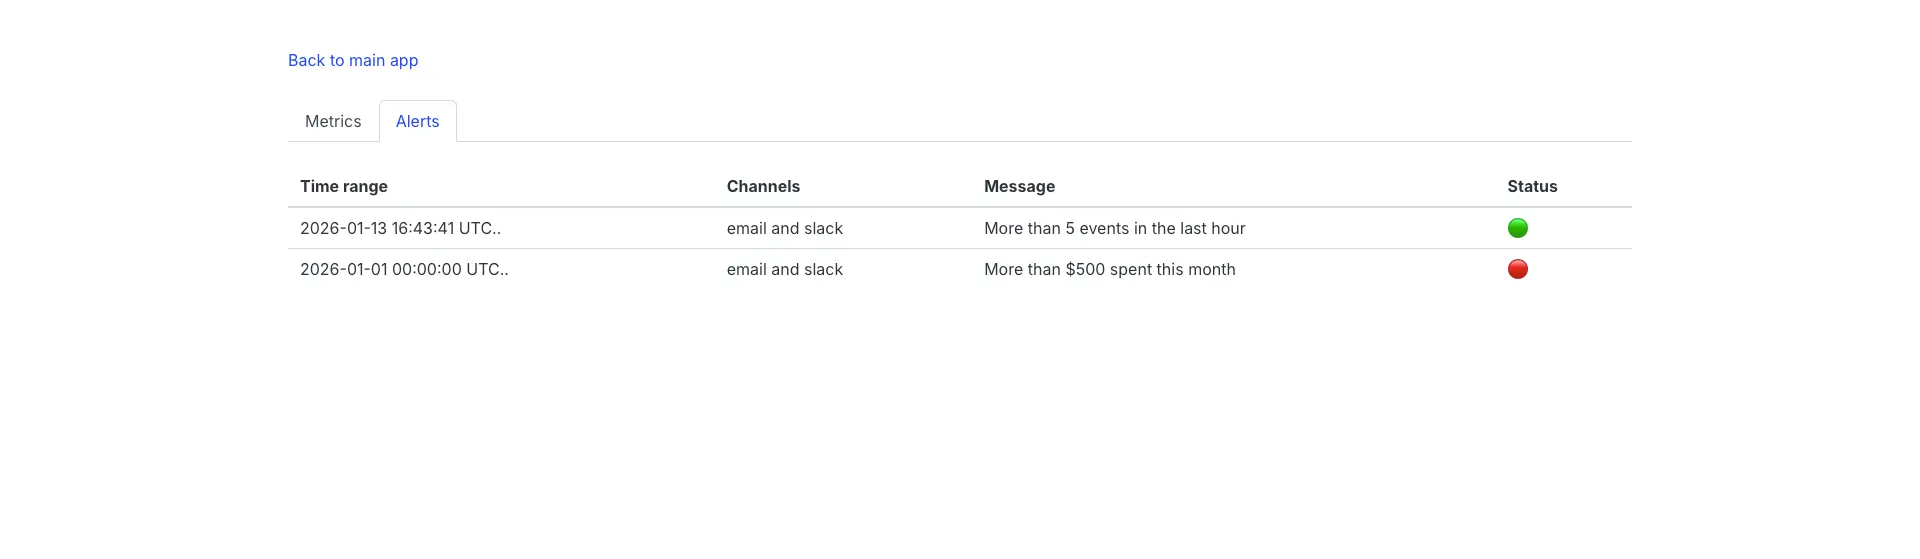
Alerts
Beyond the dashboard, you can configure custom alert rules to notify you when specific conditions are met. This is essential for catching cost overruns, error spikes, or unusual patterns before they become problems.
Alert rules are flexible and can trigger based on any condition you can express as a query. Here are some practical examples:
# config/initializers/ruby_llm_monitoring.rb
RubyLLM::Monitoring.channels = {
  email: { to: "[email protected]" },
  slack: { webhook_url: ENV["SLACK_WEBHOOK_URL"] }
}

RubyLLM::Monitoring.alert_rules += [{
  time_range: -> { Time.current.at_beginning_of_month.. },
  rule: ->(events) { events.sum(:cost) >= 500 },
  channels: [:email, :slack],
  message: { text: "More than $500 spent this month" }
}, {
  time_range: -> { 1.day.ago.. },
  rule: ->(events) { events.average(:response_time) > 5000 },
  channels: [:slack],
  message: { text: "Average response time exceeded 5 seconds" }
}]
Alert rules have built-in cooldown periods to prevent notification spam, and you can customize channels for each rule. You can even build custom notification channels beyond the built-in email and Slack options.
Conclusion
Building AI-powered features doesn’t end at deployment. The models you depend on are expensive, their performance varies, and usage patterns shift over time. Models and providers are unstable due to the rapidly evolving AI landscape. Without proper visibility, you have only guesses. So, we built RubyLLM::Monitoring.
Give it a try, send us feedback, and contribute if you want to!
At SINAPTIA, we specialize in helping businesses implement AI solutions that deliver real value. If you’re facing challenges with LLM monitoring or AI integration, we’d love to help.
References
-
If you don’t know how to do this, we’ll have a surprise for you soon. ↩